AI Evaluation Made Easy
Discover how your AI performs with Zeno.
Explore your data, uncover failures, and create beautiful, interactive charts.
Trending Projects and Reports
Explore popular public projects and reports on Zeno Hub
Testimonials
Thanks to the help of the Zeno team, our investigations of Open LLM Leaderboard evaluations were much faster.
Clémentine, Research Scientist

Demystifying benchmarkings and evaluation practices, and communicating them to a wider audience effectively is very difficult. Zeno does a great job of encouraging taking a critical look at your metrics and your datasets, which is much needed in the field!
Hailey, Research Scientist

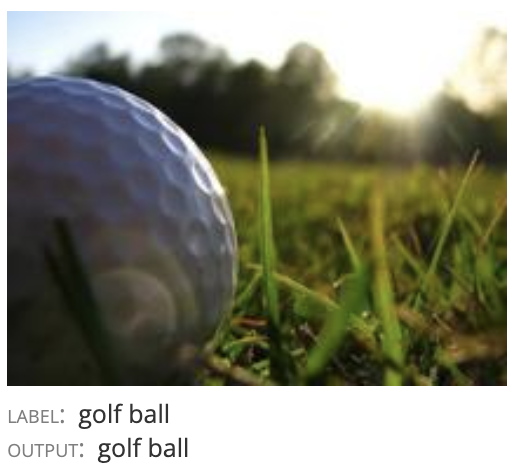
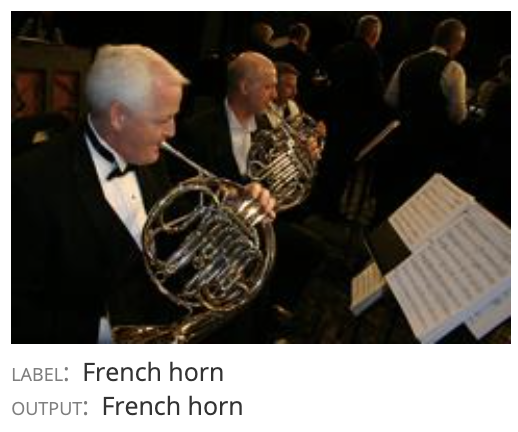
Data Exploration
Visualize any type of data with Zeno, from images to text, audio, sensor data, and more.
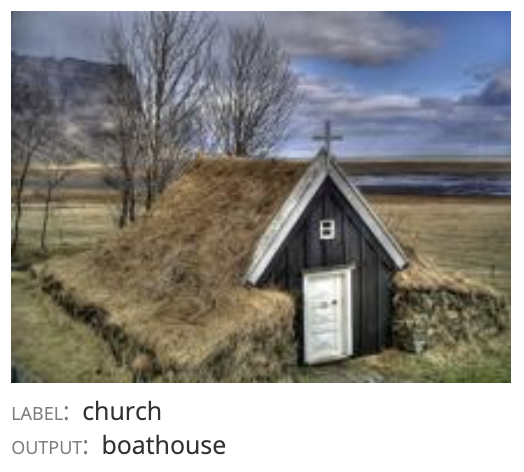
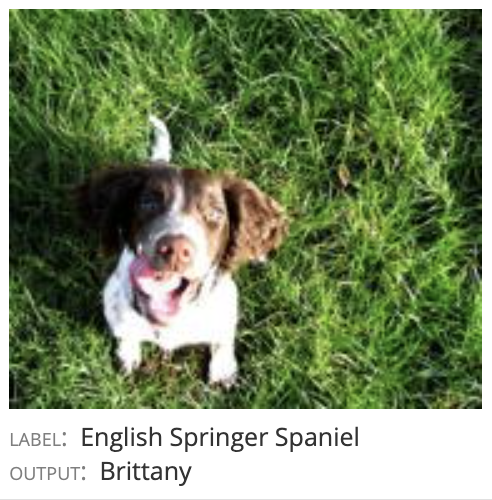
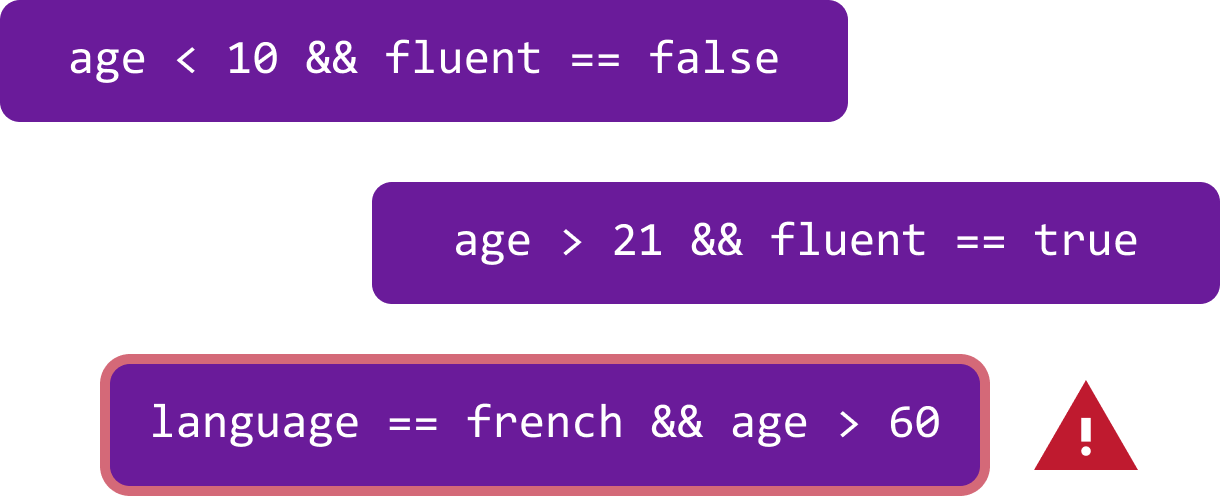
Error Discovery
Discover where your models fail with automated error analysis.
Zeno includes advanced error discovery techniques such as slice finder to automatically surface your models' systematic failures.
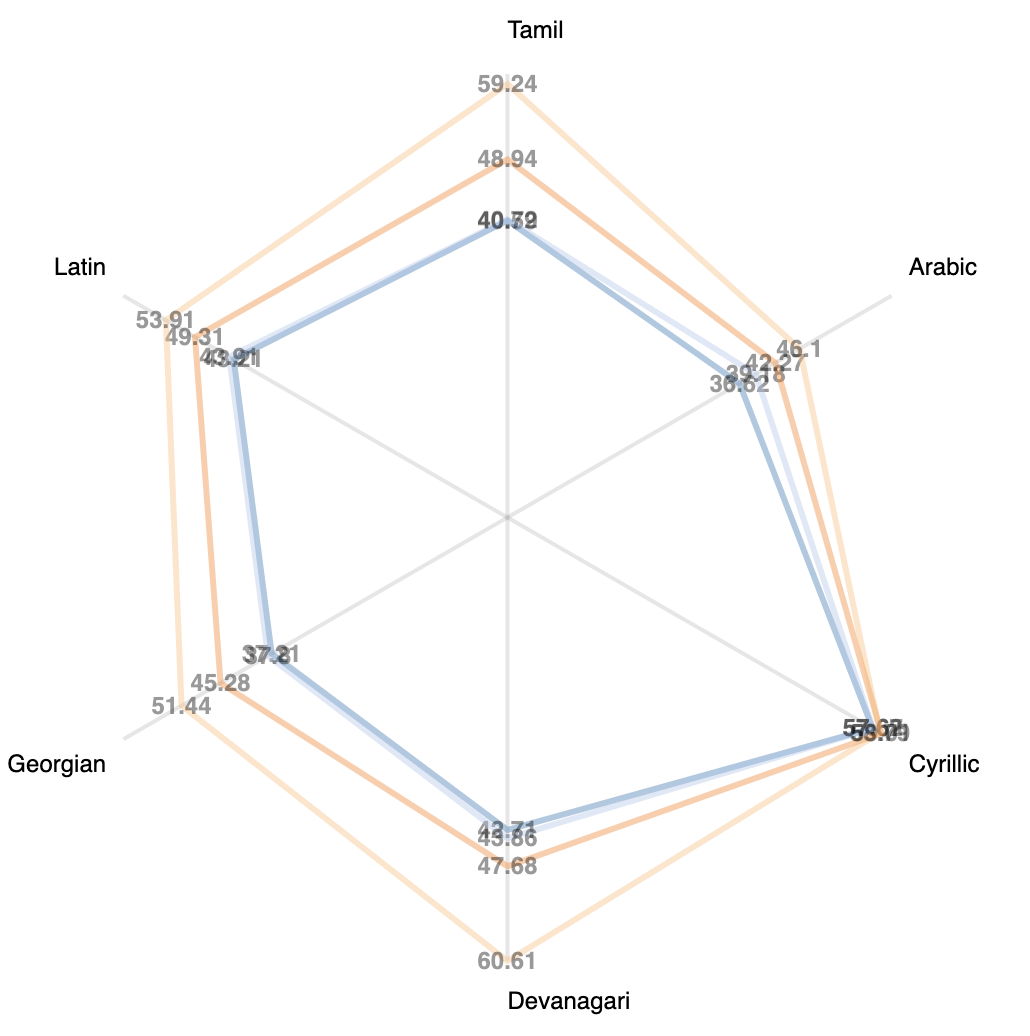
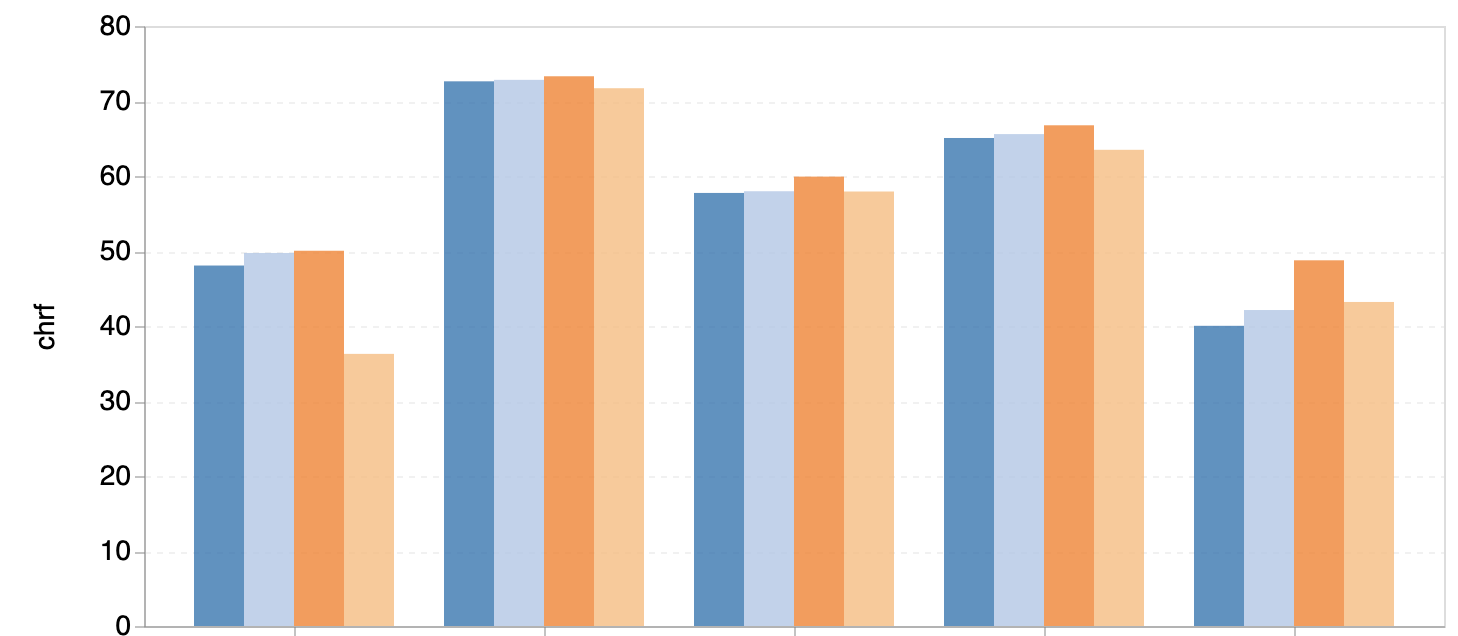
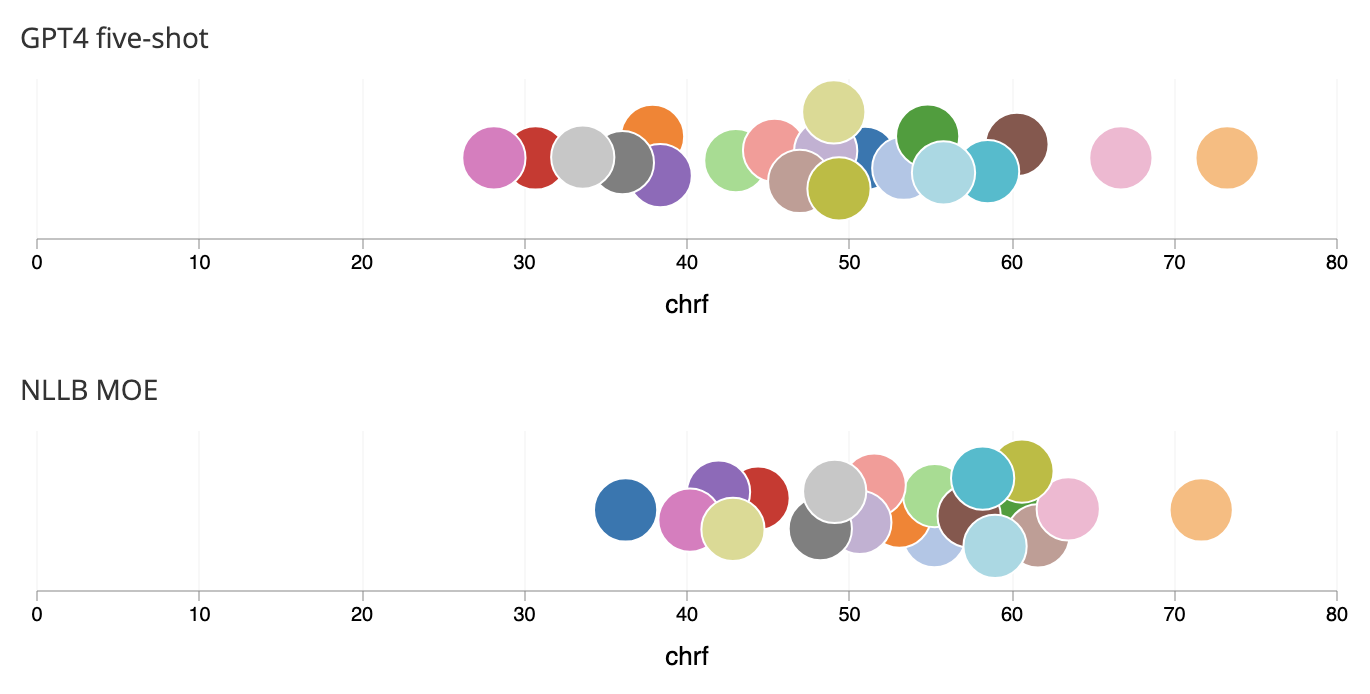
Chart Building
Create beautiful, interactive visualizations to compare model performance across slices and models
Use Zeno's drag-and-drop interface to create interactive charts. Create a radar chart comparing multiple models on different slices of your data, or a beeswarm plot to compare hundreds of models.
Report Authoring
Create reports with interactive visualizations and markdown
Visualizations can be combined with rich markdown text to share insights and tell stories about your data and model performance.
Reports can be authored collaboratively and published broadly.
Getting Started
Upload your results to Zeno in just a few lines of code
1pip install zeno-client
1from zeno_client import ZenoClient, ZenoMetric23# Initialize a client with our API key.4client = ZenoClient(YOUR_API_KEY)56# Create a project.7project = client.create_project(name="Writing Assistant", view="text-classification")89# Upload the data.10df = ... # Your DataFrame11project.upload_dataset(df, id_column="id", data_column='text', label_column="label")12system_df = ... # Your system outputs13proj.upload_system(system_df, name="GPT-4", id_column="id", output_column="output")
Sponsors and Organizations